added 108 characters in body
Source Link
Dipen
  • 2k
  • 14
  • 22

I have a site I am investigating that has major performance issues, using memcache I was able to bring number of queries down both in number and total exectution time ( from 3 secs to 230 ms) but the page execution time is eluding me ( I am looking at values outputted by devel) my understanding is that page execution time = time taken for php to execute therefore I installed APC and I can see php opcode being cached and stats showing hits in APC control panel ( apc.php shipped with APC ) but my page execution time does not go down. So I think my question is two-fold:

  • What all contributes to ( better slows down) page execution time? Is it just time taken to execute php?
  • What approaches should I take to bring down page execution time. I tried APC but not much help

P.S number of modules used on this site is just enormous ( 168 ) but right now I am not in a position to make that recommendation, its more like a fire in the hole situation.

Edit: Output of running xhprof on local instance (recommended by mikeytown), this seems to be crazy I think the later results are due to thrashing? diff runs for the same url have drastic difference and its just too much resource usage. Also not sure why is it showing values which are not from today :| (I just installed xhprof on this laptop)
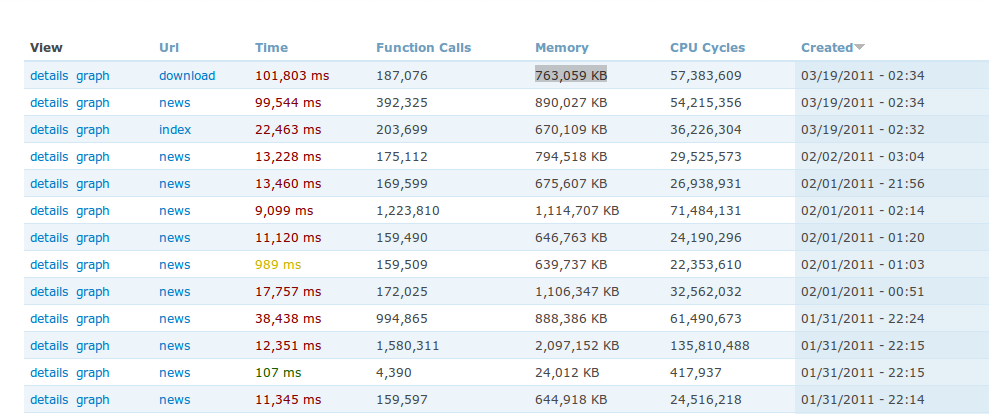
Output of running xhprof on local instance

I have a site I am investigating that has major performance issues, using memcache I was able to bring number of queries down both in number and total exectution time ( from 3 secs to 230 ms) but the page execution time is eluding me ( I am looking at values outputted by devel) my understanding is that page execution time = time taken for php to execute therefore I installed APC and I can see php opcode being cached and stats showing hits in APC control panel ( apc.php shipped with APC ) but my page execution time does not go down. So I think my question is two-fold:

  • What all contributes to ( better slows down) page execution time? Is it just time taken to execute php?
  • What approaches should I take to bring down page execution time. I tried APC but not much help

P.S number of modules used on this site is just enormous ( 168 ) but right now I am not in a position to make that recommendation, its more like a fire in the hole situation.

Edit: Output of running xhprof on local instance (recommended by mikeytown), this seems to be crazy I think the later results are due to thrashing? diff runs for the same url have drastic difference and its just too much resource usage.

Output of running xhprof on local instance

I have a site I am investigating that has major performance issues, using memcache I was able to bring number of queries down both in number and total exectution time ( from 3 secs to 230 ms) but the page execution time is eluding me ( I am looking at values outputted by devel) my understanding is that page execution time = time taken for php to execute therefore I installed APC and I can see php opcode being cached and stats showing hits in APC control panel ( apc.php shipped with APC ) but my page execution time does not go down. So I think my question is two-fold:

  • What all contributes to ( better slows down) page execution time? Is it just time taken to execute php?
  • What approaches should I take to bring down page execution time. I tried APC but not much help

P.S number of modules used on this site is just enormous ( 168 ) but right now I am not in a position to make that recommendation, its more like a fire in the hole situation.

Edit: Output of running xhprof on local instance (recommended by mikeytown), this seems to be crazy I think the later results are due to thrashing? diff runs for the same url have drastic difference and its just too much resource usage. Also not sure why is it showing values which are not from today :| (I just installed xhprof on this laptop)

Output of running xhprof on local instance

Added image of xhprof run
Source Link
Dipen
  • 2k
  • 14
  • 22

I have a site I am investigating that has major performance issues, using memcache I was able to bring number of queries down both in number and total exectution time ( from 3 secs to 230 ms) but the page execution time is eluding me ( I am looking at values outputted by devel) my understanding is that page execution time = time taken for php to execute therefore I installed APC and I can see php opcode being cached and stats showing hits in APC control panel ( apc.php shipped with APC ) but my page execution time does not go down. So I think my question is two-fold:

  • What all contributes to ( better slows down) page execution time? Is it just time taken to execute php?
  • What approaches should I take to bring down page execution time. I tried APC but not much help

P.S number of modules used on this site is just enormous ( 168 ) but right now I am not in a position to make that recommendation, its more like a fire in the hole situation.

Edit: Output of running xhprof on local instance (recommended by mikeytown), this seems to be crazy I think the later results are due to thrashing? diff runs for the same url have drastic difference and its just too much resource usage.

Output of running xhprof on local instance

I have a site I am investigating that has major performance issues, using memcache I was able to bring number of queries down both in number and total exectution time ( from 3 secs to 230 ms) but the page execution time is eluding me ( I am looking at values outputted by devel) my understanding is that page execution time = time taken for php to execute therefore I installed APC and I can see php opcode being cached and stats showing hits in APC control panel ( apc.php shipped with APC ) but my page execution time does not go down. So I think my question is two-fold:

  • What all contributes to ( better slows down) page execution time? Is it just time taken to execute php?
  • What approaches should I take to bring down page execution time. I tried APC but not much help

P.S number of modules used on this site is just enormous ( 168 ) but right now I am not in a position to make that recommendation, its more like a fire in the hole situation.

Edit: Output of running xhprof on local instance (recommended by mikeytown), this seems to be crazy I think the later results are due to thrashing? diff runs for the same url have drastic difference and its just too much resource usage.

Output of running xhprof on local instance

edited title
Link
Dipen
  • 2k
  • 14
  • 22

What all contributecontributes to drupal page execution time?

Source Link
Dipen
  • 2k
  • 14
  • 22
Loading