replaced http://drupal.stackexchange.com/ with https://drupal.stackexchange.com/
Source Link

Native charting modules

Have a look at the Comparison of Charting modules. Here is a quote from it:

There are a variety of modules that facilitate the creation of charts. When it comes to charting in Drupal, the saying "There's a module for it" doesn't really apply. In this case, it's more accurate to say, "There are plenty of modules for it" ...

These modules support for various charting libraries that may be desirable based on a site's desired appearance, feature-set, and licensing needs.

Here is the shortlist of 'native' charting modules, for which at least 1 official release exist (quote from that comparison also):

  • Forena facilitates the creation of charts by using the SVG Graph library. Forena does not depend on Views for creating charts, however it can be used as an extra views style plugin.

  • Google Chart Tools provides a simple API to build interactive SVG charts, using the Google Chart Tools.

  • Chart currently only supports the deprecated Google Chart Tools: Image Charts, which is deprecated as of April 20, 2015. Though issues #2371567, #2371075 and #2368793 are about addressing that. It is the most commonly used charting module today (over 25K reported installs, which is more then double of all other native charting modules together).

  • Charts (not to be confused with the charting module with namespace chart !!!) provides an API that can be used as a stand-alone API, and the integration with Views supports building charts with no coding.

  • Charts and Graphs, which is an API for developers. It can be extended by third-party modules that want to add their own charting implementations. It does nothing by itself. It should only be installed if some other module requires it. Views Charts is one of the modules using it.

  • Flot provides an API and views integration for using the Flot graphing library.

Note: there are quite a few additional 'native' charting modules, though they do not have an official release (yet), only dev, alfa or beta versions.

Forena showcase

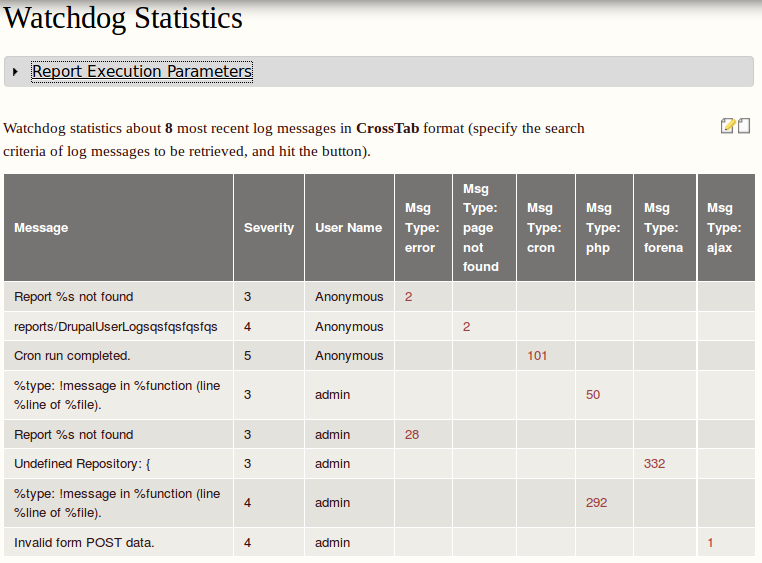
Have a look at my answer to "http"https://drupal.stackexchange.com/questions/180421/views-table-with-taxonomy-terms-for-columns-and-rows/180603#180603", which details how I once created a crosstab report (using the Forena module) that looked like so:

enter image description here

Then look at the video demo "How to create Crosstab Tables and (related) charts" to get an idea what it takes to create a chart from such crosstab tables.

Disclosure: I'm the author of the comparison and co-maintainer of the Charts, Chart and Forena.

Native charting modules

Have a look at the Comparison of Charting modules. Here is a quote from it:

There are a variety of modules that facilitate the creation of charts. When it comes to charting in Drupal, the saying "There's a module for it" doesn't really apply. In this case, it's more accurate to say, "There are plenty of modules for it" ...

These modules support for various charting libraries that may be desirable based on a site's desired appearance, feature-set, and licensing needs.

Here is the shortlist of 'native' charting modules, for which at least 1 official release exist (quote from that comparison also):

  • Forena facilitates the creation of charts by using the SVG Graph library. Forena does not depend on Views for creating charts, however it can be used as an extra views style plugin.

  • Google Chart Tools provides a simple API to build interactive SVG charts, using the Google Chart Tools.

  • Chart currently only supports the deprecated Google Chart Tools: Image Charts, which is deprecated as of April 20, 2015. Though issues #2371567, #2371075 and #2368793 are about addressing that. It is the most commonly used charting module today (over 25K reported installs, which is more then double of all other native charting modules together).

  • Charts (not to be confused with the charting module with namespace chart !!!) provides an API that can be used as a stand-alone API, and the integration with Views supports building charts with no coding.

  • Charts and Graphs, which is an API for developers. It can be extended by third-party modules that want to add their own charting implementations. It does nothing by itself. It should only be installed if some other module requires it. Views Charts is one of the modules using it.

  • Flot provides an API and views integration for using the Flot graphing library.

Note: there are quite a few additional 'native' charting modules, though they do not have an official release (yet), only dev, alfa or beta versions.

Forena showcase

Have a look at my answer to "http://drupal.stackexchange.com/questions/180421/views-table-with-taxonomy-terms-for-columns-and-rows/180603#180603", which details how I once created a crosstab report (using the Forena module) that looked like so:

enter image description here

Then look at the video demo "How to create Crosstab Tables and (related) charts" to get an idea what it takes to create a chart from such crosstab tables.

Disclosure: I'm the author of the comparison and co-maintainer of the Charts, Chart and Forena.
Native charting modules

Have a look at the Comparison of Charting modules. Here is a quote from it:

There are a variety of modules that facilitate the creation of charts. When it comes to charting in Drupal, the saying "There's a module for it" doesn't really apply. In this case, it's more accurate to say, "There are plenty of modules for it" ...

These modules support for various charting libraries that may be desirable based on a site's desired appearance, feature-set, and licensing needs.

Here is the shortlist of 'native' charting modules, for which at least 1 official release exist (quote from that comparison also):

  • Forena facilitates the creation of charts by using the SVG Graph library. Forena does not depend on Views for creating charts, however it can be used as an extra views style plugin.

  • Google Chart Tools provides a simple API to build interactive SVG charts, using the Google Chart Tools.

  • Chart currently only supports the deprecated Google Chart Tools: Image Charts, which is deprecated as of April 20, 2015. Though issues #2371567, #2371075 and #2368793 are about addressing that. It is the most commonly used charting module today (over 25K reported installs, which is more then double of all other native charting modules together).

  • Charts (not to be confused with the charting module with namespace chart !!!) provides an API that can be used as a stand-alone API, and the integration with Views supports building charts with no coding.

  • Charts and Graphs, which is an API for developers. It can be extended by third-party modules that want to add their own charting implementations. It does nothing by itself. It should only be installed if some other module requires it. Views Charts is one of the modules using it.

  • Flot provides an API and views integration for using the Flot graphing library.

Note: there are quite a few additional 'native' charting modules, though they do not have an official release (yet), only dev, alfa or beta versions.

Forena showcase

Have a look at my answer to "https://drupal.stackexchange.com/questions/180421/views-table-with-taxonomy-terms-for-columns-and-rows/180603#180603", which details how I once created a crosstab report (using the Forena module) that looked like so:

enter image description here

Then look at the video demo "How to create Crosstab Tables and (related) charts" to get an idea what it takes to create a chart from such crosstab tables.

Disclosure: I'm the author of the comparison and co-maintainer of the Charts, Chart and Forena.

Add Forena showcase
Source Link
Pierre.Vriens
  • 36k
  • 40
  • 50
  • 182

Native charting modules

Consider lookingHave a look at the Comparison of Charting modules. Here is a quote from it:

There are a variety of modules that facilitate the creation of charts. When it comes to charting in Drupal, the saying "There's a module for it" doesn't really apply. In this case, it's more accurate to say, "There are plenty of modules for it" ...

These modules support for various charting libraries that may be desirable based on a site's desired appearance, feature-set, and licensing needs.

Here is the shortlist of 'native' charting modules, for which at least 1 official release exist (quote from that comparison also):

  • Forena facilitates the creation of charts by using the SVG Graph library. Forena does not depend on Views for creating charts, however it can be used as an extra views style plugin.

  • Google Chart Tools provides a simple API to build interactive SVG charts, using the Google Chart Tools.

  • Chart currently only supports the deprecated Google Chart Tools: Image Charts, which is deprecated as of April 20, 2015. Though issues #2371567, #2371075 and #2368793 are about addressing that. It is the most commonly used charting module today (over 25K reported installs, which is more then double of all other native charting modules together).

  • Charts (not to be confused with the charting module with namespace chart !!!) provides an API that can be used as a stand-alone API, and the integration with Views supports building charts with no coding.

  • Charts and Graphs, which is an API for developers. It can be extended by third-party modules that want to add their own charting implementations. It does nothing by itself. It should only be installed if some other module requires it. Views Charts is one of the modules using it.

  • Flot provides an API and views integration for using the Flot graphing library.

Note: there are quite a few additionalladditional 'native' charting modules, though they do not have an official release (yet), only dev, alfa or beta versions.

Forena showcase

Have a look at my answer to "http://drupal.stackexchange.com/questions/180421/views-table-with-taxonomy-terms-for-columns-and-rows/180603#180603", which details how I once created a crosstab report (using the Forena module) that looked like so:

enter image description here

Then look at the video demo "How to create Crosstab Tables and (related) charts" to get an idea what it takes to create a chart from such crosstab tables.

Disclosure: I'm the author of the comparison and co-maintainer of the Charts, Chart and Forena, I hope this does not violate the site's policy on self-promotion.

Consider looking at the Comparison of Charting modules. Here is a quote from it:

There are a variety of modules that facilitate the creation of charts. When it comes to charting in Drupal, the saying "There's a module for it" doesn't really apply. In this case, it's more accurate to say, "There are plenty of modules for it" ...

These modules support for various charting libraries that may be desirable based on a site's desired appearance, feature-set, and licensing needs.

Here is the shortlist of 'native' charting modules, for which at least 1 official release exist (quote from that comparison also):

  • Forena facilitates the creation of charts by using the SVG Graph library. Forena does not depend on Views for creating charts, however it can be used as an extra views style plugin.

  • Google Chart Tools provides a simple API to build interactive SVG charts, using the Google Chart Tools.

  • Chart currently only supports the deprecated Google Chart Tools: Image Charts, which is deprecated as of April 20, 2015. Though issues #2371567, #2371075 and #2368793 are about addressing that. It is the most commonly used charting module today (over 25K reported installs, which is more then double of all other native charting modules together).

  • Charts (not to be confused with the charting module with namespace chart !!!) provides an API that can be used as a stand-alone API, and the integration with Views supports building charts with no coding.

  • Charts and Graphs, which is an API for developers. It can be extended by third-party modules that want to add their own charting implementations. It does nothing by itself. It should only be installed if some other module requires it. Views Charts is one of the modules using it.

  • Flot provides an API and views integration for using the Flot graphing library.

Note: there are quite a few additionall 'native' charting modules, though they do not have an official release (yet), only dev, alfa or beta versions.

Disclosure: I'm the author of the comparison and co-maintainer of the Charts, Chart and Forena, I hope this does not violate the site's policy on self-promotion.

Native charting modules

Have a look at the Comparison of Charting modules. Here is a quote from it:

There are a variety of modules that facilitate the creation of charts. When it comes to charting in Drupal, the saying "There's a module for it" doesn't really apply. In this case, it's more accurate to say, "There are plenty of modules for it" ...

These modules support for various charting libraries that may be desirable based on a site's desired appearance, feature-set, and licensing needs.

Here is the shortlist of 'native' charting modules, for which at least 1 official release exist (quote from that comparison also):

  • Forena facilitates the creation of charts by using the SVG Graph library. Forena does not depend on Views for creating charts, however it can be used as an extra views style plugin.

  • Google Chart Tools provides a simple API to build interactive SVG charts, using the Google Chart Tools.

  • Chart currently only supports the deprecated Google Chart Tools: Image Charts, which is deprecated as of April 20, 2015. Though issues #2371567, #2371075 and #2368793 are about addressing that. It is the most commonly used charting module today (over 25K reported installs, which is more then double of all other native charting modules together).

  • Charts (not to be confused with the charting module with namespace chart !!!) provides an API that can be used as a stand-alone API, and the integration with Views supports building charts with no coding.

  • Charts and Graphs, which is an API for developers. It can be extended by third-party modules that want to add their own charting implementations. It does nothing by itself. It should only be installed if some other module requires it. Views Charts is one of the modules using it.

  • Flot provides an API and views integration for using the Flot graphing library.

Note: there are quite a few additional 'native' charting modules, though they do not have an official release (yet), only dev, alfa or beta versions.

Forena showcase

Have a look at my answer to "http://drupal.stackexchange.com/questions/180421/views-table-with-taxonomy-terms-for-columns-and-rows/180603#180603", which details how I once created a crosstab report (using the Forena module) that looked like so:

enter image description here

Then look at the video demo "How to create Crosstab Tables and (related) charts" to get an idea what it takes to create a chart from such crosstab tables.

Disclosure: I'm the author of the comparison and co-maintainer of the Charts, Chart and Forena.

added 2131 characters in body
Source Link
Pierre.Vriens
  • 36k
  • 40
  • 50
  • 182

Consider looking at the Comparison of Charting modules. Here is a quote from it:

There are a variety of modules that facilitate the creation of charts. When it comes to charting in Drupal, the saying "There's a module for it" doesn't really apply. In this case, it's more accurate to say, "There are plenty of modules for it" ...

These modules support for various charting libraries that may be desirable based on a site's desired appearance, feature-set, and licensing needs.

Here is the shortlist of 'native' charting modules, for which at least 1 official release exist (quote from that comparison also):

  • Forena Reports facilitates the creation of charts by using the SVG Graph library. Forena does not depend on Views for creating charts, however it can be used as an extra views style plugin.

  • Google Chart Tools provides a simple API to build interactive SVG charts, using the Google Chart Tools.

  • Google Chart Tools: Image ChartsChart currently only supports the deprecated Google Chart Tools: Image Charts, which is deprecated as of April 20, 2015. Though issues #2371567#2371567, #2371075#2371075 and #2368793#2368793 are about addressing that. It is the most commonly used charting module today (over 25K reported installs, which is more then double of all other native charting modules together).

  • Charts (not to be confused with the charting module with namespace chart !!!) provides an API that can be used as a stand-alone API, and the integration with Views supports building charts with no coding.

  • Charts and GraphsCharts and Graphs, which is an API for developers. It can be extended by third-party modules that want to add their own charting implementations. It does nothing by itself. It should only be installed if some other module requires it. Views ChartsViews Charts is one of the modules using it, while [#2364427] is a forena feature request to also consider using it.

  • FlotFlot provides an API and views integration for using the <a href="http://code.google.com/p/flot "target="_blank">flotFlot graphing library.

DisclosureNote: there are quite a few additionall 'native' charting modules, though they do not have an official release (yet), only dev, alfa or beta versions.

Disclosure: I'm the author of the comparison and co-maintainer of the (+ some charting modules mentioned on my profile)Charts, Chart and Forena, I hope this does not violate the site's policy on self-promotion.

Consider looking at the Comparison of Charting modules. Here is a quote from it:

There are a variety of modules that facilitate the creation of charts. When it comes to charting in Drupal, the saying "There's a module for it" doesn't really apply. In this case, it's more accurate to say, "There are plenty of modules for it" ...

These modules support for various charting libraries that may be desirable based on a site's desired appearance, feature-set, and licensing needs.

Here is the shortlist of 'native' charting modules, for which at least 1 official release exist (quote from that comparison also):

  • Forena Reports facilitates the creation of charts by using the SVG Graph library. Forena does not depend on Views for creating charts, however it can be used as an extra views style plugin.

  • Google Chart Tools provides a simple API to build interactive SVG charts, using the Google Chart Tools.

  • Google Chart Tools: Image Charts currently only supports the deprecated Google Chart Tools: Image Charts, which is deprecated as of April 20, 2015. Though issues #2371567, #2371075 and #2368793 are about addressing that. It is the most commonly used charting module today (over 25K reported installs, which is more then double of all other native charting modules together).

  • Charts (not to be confused with the charting module with namespace chart !!!) provides an API that can be used as a stand-alone API, and the integration with Views supports building charts with no coding.

  • Charts and Graphs, which is an API for developers. It can be extended by third-party modules that want to add their own charting implementations. It does nothing by itself. It should only be installed if some other module requires it. Views Charts is one of the modules using it, while [#2364427] is a forena feature request to also consider using it.

  • Flot provides an API and views integration for using the <a href="http://code.google.com/p/flot "target="_blank">flot graphing library.

Disclosure: I'm the author of the comparison (+ some charting modules mentioned on my profile), I hope this does not violate the site's policy on self-promotion.

Consider looking at the Comparison of Charting modules. Here is a quote from it:

There are a variety of modules that facilitate the creation of charts. When it comes to charting in Drupal, the saying "There's a module for it" doesn't really apply. In this case, it's more accurate to say, "There are plenty of modules for it" ...

These modules support for various charting libraries that may be desirable based on a site's desired appearance, feature-set, and licensing needs.

Here is the shortlist of 'native' charting modules, for which at least 1 official release exist (quote from that comparison also):

  • Forena facilitates the creation of charts by using the SVG Graph library. Forena does not depend on Views for creating charts, however it can be used as an extra views style plugin.

  • Google Chart Tools provides a simple API to build interactive SVG charts, using the Google Chart Tools.

  • Chart currently only supports the deprecated Google Chart Tools: Image Charts, which is deprecated as of April 20, 2015. Though issues #2371567, #2371075 and #2368793 are about addressing that. It is the most commonly used charting module today (over 25K reported installs, which is more then double of all other native charting modules together).

  • Charts (not to be confused with the charting module with namespace chart !!!) provides an API that can be used as a stand-alone API, and the integration with Views supports building charts with no coding.

  • Charts and Graphs, which is an API for developers. It can be extended by third-party modules that want to add their own charting implementations. It does nothing by itself. It should only be installed if some other module requires it. Views Charts is one of the modules using it.

  • Flot provides an API and views integration for using the Flot graphing library.

Note: there are quite a few additionall 'native' charting modules, though they do not have an official release (yet), only dev, alfa or beta versions.

Disclosure: I'm the author of the comparison and co-maintainer of the Charts, Chart and Forena, I hope this does not violate the site's policy on self-promotion.

added 2131 characters in body
Source Link
Pierre.Vriens
  • 36k
  • 40
  • 50
  • 182
Loading
Source Link
Pierre.Vriens
  • 36k
  • 40
  • 50
  • 182
Loading