3

I have newrelic performance monitoring with my Pantheon hosting account. It shows "slow SQL" reports but I can't tell which page, view or module is generating a SQL statement.

For example:

SELECT node.nid AS nid, node.title AS node_title, users_node.name AS users_node_name, users_node.uid AS users_node_uid, node.created AS node_created, '?' AS field_data_field_photo_node_entity_type FROM node node INNER JOIN users users_node ON node.uid = users_node.uid LEFT JOIN field_data_field_photo_topic field_data_field_photo_topic ON node.nid = field_data_field_photo_topic.entity_id AND field_data_field_photo_topic.field_photo_topic_tid = :views_join_condition_? WHERE (( (node.status = :db_condition_placeholder_?) AND (users_node.uid = :users_uid? ) )AND(( (node.type IN (:db_condition_placeholder_?)) AND (field_data_field_photo_topic.field_photo_topic_tid IS NULL ) ))) ORDER BY node_created DESC LIMIT ? OFFSET ?

How could I get that info?

2
  • Do you also see the timestamps? I suspect this is output from the MySQL Slow Query Log, but IIRC that also has timestamps.
    – mpdonadio
    Jul 20, 2012 at 19:20
  • it shows a "start time", for example 07/20/12 10:50:31. How would that help? The output is from the newrelic.com monitoring tool.
    – uwe
    Jul 20, 2012 at 19:44

2 Answers 2

3

If the query is executed from the Views module (as it seems in your case), then you can look for the view that executes that query.

Go on admin/structure/views/settings, and select "Show the SQL query"; if that doesn't help there is also the " Show other queries run during render during live preview" option.

screenshot

For example, this is the output I got for the tracker view.

screenshot

On admin/structure/views/settings/advanced, there is also the "Add Views signature to all SQL queries" which has the following description:

All Views-generated queries will include the name of the views and display 'view-name:display-name' as a string at the end of the SELECT clause. This makes identifying Views queries in database server logs simpler, but should only be used when troubleshooting.

screenshot

In the previous example, the query becomes the following one. (Notice the 'tracker:default' AS view_name part.)

SELECT node.type AS node_type, node.title AS node_title, node.nid AS nid, node.language AS node_language, users_node.name AS users_node_name, users_node.uid AS users_node_uid, node_comment_statistics.comment_count AS node_comment_statistics_comment_count, node_comment_statistics.last_comment_timestamp AS node_comment_statistics_last_comment_timestamp, history.timestamp AS history_timestamp, node.created AS node_created, node.changed AS node_changed, 'tracker:default' AS view_name
FROM 
{node} node
LEFT JOIN {users} users_node ON node.uid = users_node.uid
INNER JOIN {node_comment_statistics} node_comment_statistics ON node.nid = node_comment_statistics.nid
LEFT JOIN {history} history ON node.nid = history.nid AND history.uid = '1'
WHERE (( (node.status = '1') ))
ORDER BY node_comment_statistics_last_comment_timestamp DESC
LIMIT 25 OFFSET 0
4
  • that's a great option. Do you know if there is a performance hit for it since there is a "..but should only be used when troubleshooting" warning?
    – uwe
    Jul 20, 2012 at 19:48
  • I don't see any performance hit, and I don't think that adding 'tracker:default' AS view_name makes the query much slower. I guess the description means that, as debugging information is being added, that should be done when strictly necessary, such as when you are troubleshooting.
    – apaderno
    Jul 20, 2012 at 19:57
  • When turning on "views signatures" it shows up as '?' AS view_name in the newrelic "Slow SQL" log because they don't show the actual value for the query. Instead, when I use the "views query settings" option and add a "query comment" it will show up at the beginning of the query like this: /* my comment */ SELECT
    – uwe
    Jul 28, 2012 at 15:49
  • > Instead, when I use the "views query settings" option and add a "query comment" it will show up at the beginning of the query like this: /* my comment */ SELECT. New Relic seems to strip down any comments at the beginning of a query. Only when I place the comments after the SELECT keyword, I can see them in New Relic. That requires a small hack though: Drupal/Views query comments in New Relic Nov 19, 2012 at 17:14
4

I suspect your logs are are the output from the MySQL Slow Query Log. What ends up here varies based on server configuration, but they general culprits are

  1. Queries that take a long time
  2. Queries that don't use indexes

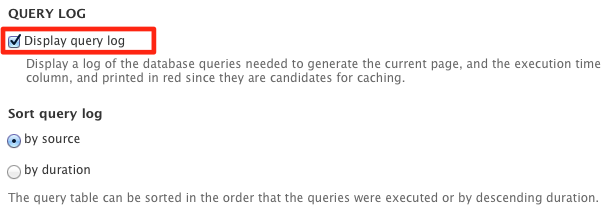
My suggestion is to try to match up the timestamps (start time) to the Apache access_log to get a page. Then, use the Devel module and enable "Display query log" from admin/config/development/devel. This will record queries and log them along with execution times.

screenshot

It looks like that bad query is tied to a view. For these, enable "Add Views signature to all SQL queries" on the Advanced settings page. When you do this you can identify which view is slow.

To resolve the "slowness", copy the query and hand edit to add in the parameters. Then open a MySQL tool, and use the EXPLAIN statement. Look at what it tells you and go from there.

2
  • thanks. I'm familiar with the "Display query log" but didn't know those also get logged somewhere. How can I access those logs?
    – uwe
    Jul 20, 2012 at 23:20
  • 1
    I meant that that Drupal logs them and tacks them onto pages. The MySQL General Log and Slow Query Log are settings in my.cnf and (if enabled) are typically stored in the same location as the data files.
    – mpdonadio
    Jul 21, 2012 at 12:46

Your Answer

By clicking “Post Your Answer”, you agree to our terms of service and acknowledge you have read our privacy policy.

Not the answer you're looking for? Browse other questions tagged or ask your own question.