0

I installed the Chart module and I'm using it in my Views display.

I have a field: Score

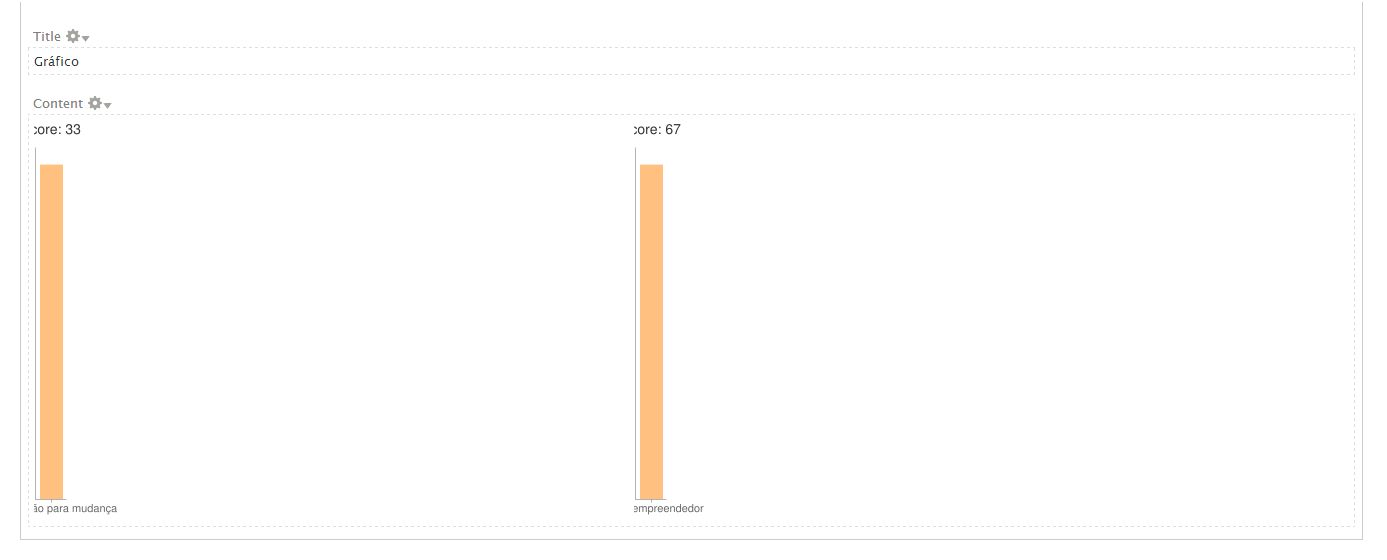
I added a chart but it shows two different charts (see image) instead of just one with all the results from that field.

enter image description here

How can I put them together? If it's with aggregation, can you give me some guides?

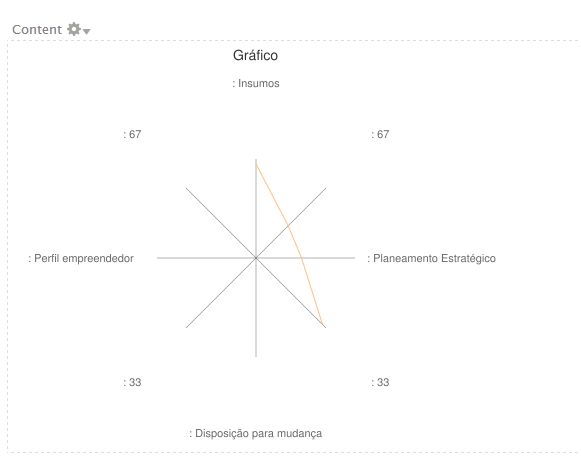
Here is how another attempt looks like:

enter image description here

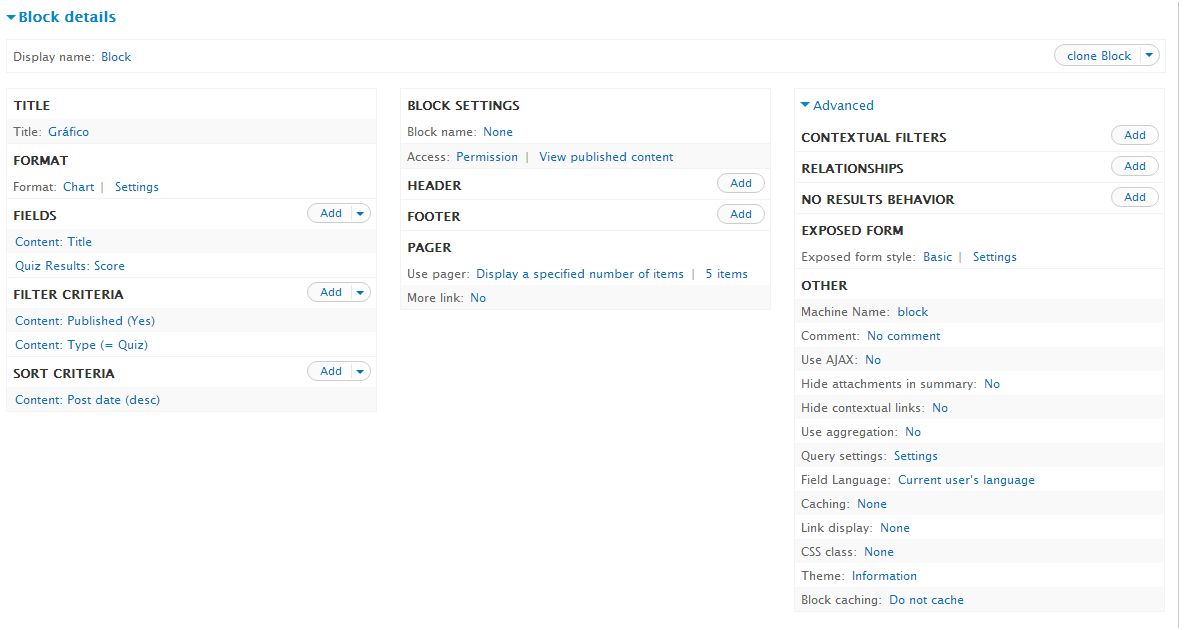
And this is how my View currently looks like:

enter image description here

The tabular format of its data to be charted looks like so:

enter image description here

Notes:

  • I'm using the Chart module because I need the "radar" type which only exists in that module.
  • I want to create a chart with all the scores displayed in the table, and not one chart per score.
  • I don't want all the fields to appear as data, as in the last pictures in my question. I want the text to be the legend and the number to be the data.
3
  • did you check this: drupal.stackexchange.com/questions/43906/…
    – Shabir A.
    Commented Dec 10, 2015 at 13:21
  • I just edited my post and added a few more images... Now it's in table format. See, I want to create a chart with all the scores displayed in the table, and not one chart per score...
    – Drii7
    Commented Dec 10, 2015 at 14:26
  • I integrated relevant (I think) details in some of your comments in the "notes" part of your question now. Please review my edits of your question, and adapt/rework as you see fit (e.g. move those notes somewhere else in your question). After you do so, I suggest you also remove some of your comments in your question and my answer, to further cleanup things. Later on (probably tomorrow) I'll come back to my answer here, and try to further refine it as much as I can. Commented Dec 10, 2015 at 18:41

1 Answer 1

4

This kind of questions show up quite often. And each time I try to get them resolved with this very first attempt (if it is related to a Views display):

You may find it easier to start with a "Table" display and convert it to a chart display after setting up the data. It can be easier to visualize what the result of the chart will be if it's been laid out in a table first.

In my experience, 90% of the issues turn out to be related to errors in the creation of the table that contains the data to be charted.

If this question is about creating a chart using the Views integration, then refer to the appropriate Community documentation resources with more details about how to do so:

Disclosure: I'm a (co-)maintainer of both Chart and Charts, and co-author of the documentation resources mentioned.

7
  • I'm using the chart module because I need the "radar" type which only exists in that module, but I can't find any information on your link... I have this (please check the two last pictures in my post, I edited) but I don't want all the fields to appear as data... I want the text to be the legend and the number to be tha data, and not showing up. I know i'm close, can you help me figure this out? Thank you...
    – Drii7
    Commented Dec 10, 2015 at 15:16
  • I'm using the drupal.org/project/chart but now I see "We do not recommend using this module for any new projects". Maybe I should try it with another module... it's a shame 'cause I wanted the radar chart type. Should I try with charts?
    – Drii7
    Commented Dec 10, 2015 at 15:42
  • I actually made it to work using the charts module!! But I can't find a radar chart. I don't know if it is possible to do it with highcharts library but I couldn't, maybe something wrong on the installation... If I post this as a new question, will you be able to answer it? Thank you
    – Drii7
    Commented Dec 10, 2015 at 16:20
  • You're going too fast for me (I can't keep up with answering all your questions). Good to hear you made some progress by using charts (as I recommended). And as in my prior comment: yes go ahead and create a NEW question. "Later on" (maybe only tomorrow?) I will also try to answer that one ... Here is already a hint about what part of my answer to such question will include: drupal.org/files/RadarGraph.png ... That's what "I" think a "Radar" chart looks like, is that similar to what "you" call a radar chart? If so, your new question could be as simple as "How did you do that?!?!". Commented Dec 10, 2015 at 16:31
  • Yes!! How did you do that?!?! drupal.stackexchange.com/questions/183596/…
    – Drii7
    Commented Dec 10, 2015 at 16:36

Your Answer

By clicking “Post Your Answer”, you agree to our terms of service and acknowledge you have read our privacy policy.

Not the answer you're looking for? Browse other questions tagged or ask your own question.