0

I use charts module Charts and I want to create a view that shows the stats from a date range.

I have an exposed filter and this filter has a between range. I want to show all dates from values of exposed filter.

I provided the values 7/10/2015 and 15/10/2015 as my date range and always show the dates if no stats exist for specific days in this range.

For example: 7/10/2015, 8/10/2015, 9/10/2015, 10/10/2015, 11/10/2015, etc. up to 15/10/2015,

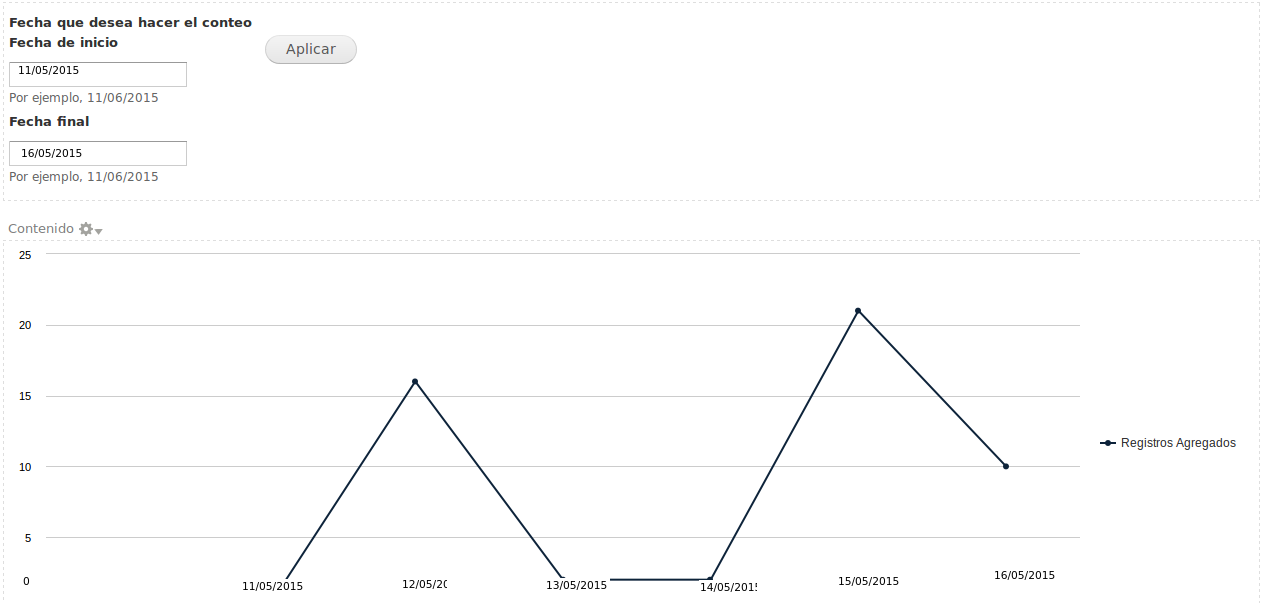
Attached an image to understand what I want (how the chart should look like).

image range dates

How can I do this, with filter, arguments or handlers, please give me a example.

For this moment the module "views between date filter" is not working as I want: it only shows all dates for which some data exist. But always need show the dates that no have results.

0

1 Answer 1

0

I'm assuming you're using the Charts module and that your problem is similar to what is detailed in Comment nr 12 of Issue nr 2052429. Here is part of what that comment includes:

... It's not an issue Google Charts could actually fix, as there is no "labels" sent to Google Charts for the chart addons for it to recognise gaps in the data ...

So at a minimum I recommend you to try the most recent DEV version, and apply the patch attached to that comment, to check if that helps in your case. If it doesn't, know that it is a prereq for sure (without that patch you won't be able to get it to work).

If applying the patch is not sufficient, then I'd recommend what's written in the "Bonus tip" of Steps to create charts using the views UI, i.e.:

You may find it easier to start with a "Table" display and convert it to a chart display after setting up the data. It can be easier to visualize what the result of the chart will be if it's been laid out in a table first.

In other words: before trying to create a chart, make sure the tabular version of it has the correct data displayed.

Disclosure: I'm a co-maintainer of the Charts module (+ author of its community documentation),
I hope this does not violate the site's policy on self-promotion.

4
  • sorry my english is no good, y try the latest version of charts module and i tell you
    – jonathan
    Commented Nov 9, 2015 at 14:48
  • thank you for the update. Make sure to use the latest "dev" version of the charts module. It is really stable, and fixes multiple issues that exist in the RC1 version (and probably soon to be released as a next official release. Let me know how it goes (via an extra comment here), ok? Ps: please EDIT your question to add the CHARTS module link somewhere in your question (as I suggested before). Commented Nov 9, 2015 at 14:52
  • i use the lastest version dev of charts module, but continue without make the functionality that i want, any idea to make the stats that i want, always show the date range, first i dont know how to show fields, provide to filter views, always show the range, but first i need to create the field that show this range but i dont know how, thanks again
    – jonathan
    Commented Nov 9, 2015 at 16:21
  • Hm, that sounds like you have "a few" (1 or more?) other questions you need to get sorted out (before you have a chance to succeed with the chart you asked about in this question). Attempt to get you going: please look at my answers to the questions at drupal.stackexchange.com/search?q=user%3A39516+[charts]+date ... If needed feel free to add a comment to any of my answers there (related to the specific question/answer). Otherwise create 1 (or more) new specific questions, to find the answer(s) step by step. OK? Commented Nov 9, 2015 at 16:54

Your Answer

By clicking “Post Your Answer”, you agree to our terms of service and acknowledge you have read our privacy policy.

Not the answer you're looking for? Browse other questions tagged or ask your own question.