Solution 1 - Use Charts to create a pie chart
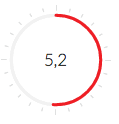
The sample image in your question doesn't look like a pie chart to me, instead it rather looks like a Gauge chart. If you want to try to create a pie chart anyway, using the Charts module, then have a look at this feature request (which allows you to pass "library specific options"). Comment #9 in it contains a patch that you'll need for it (using Google Charts as the rendering engine).
After you applied that patch, you'll be able to pass any of the specific options to the Google Charts charting engine that correspond to the chart you're trying to create.
If applying the patch is not sufficient, then I'd recommend what's written in the "Bonus tip" of Steps to create charts using the views UI, i.e.:
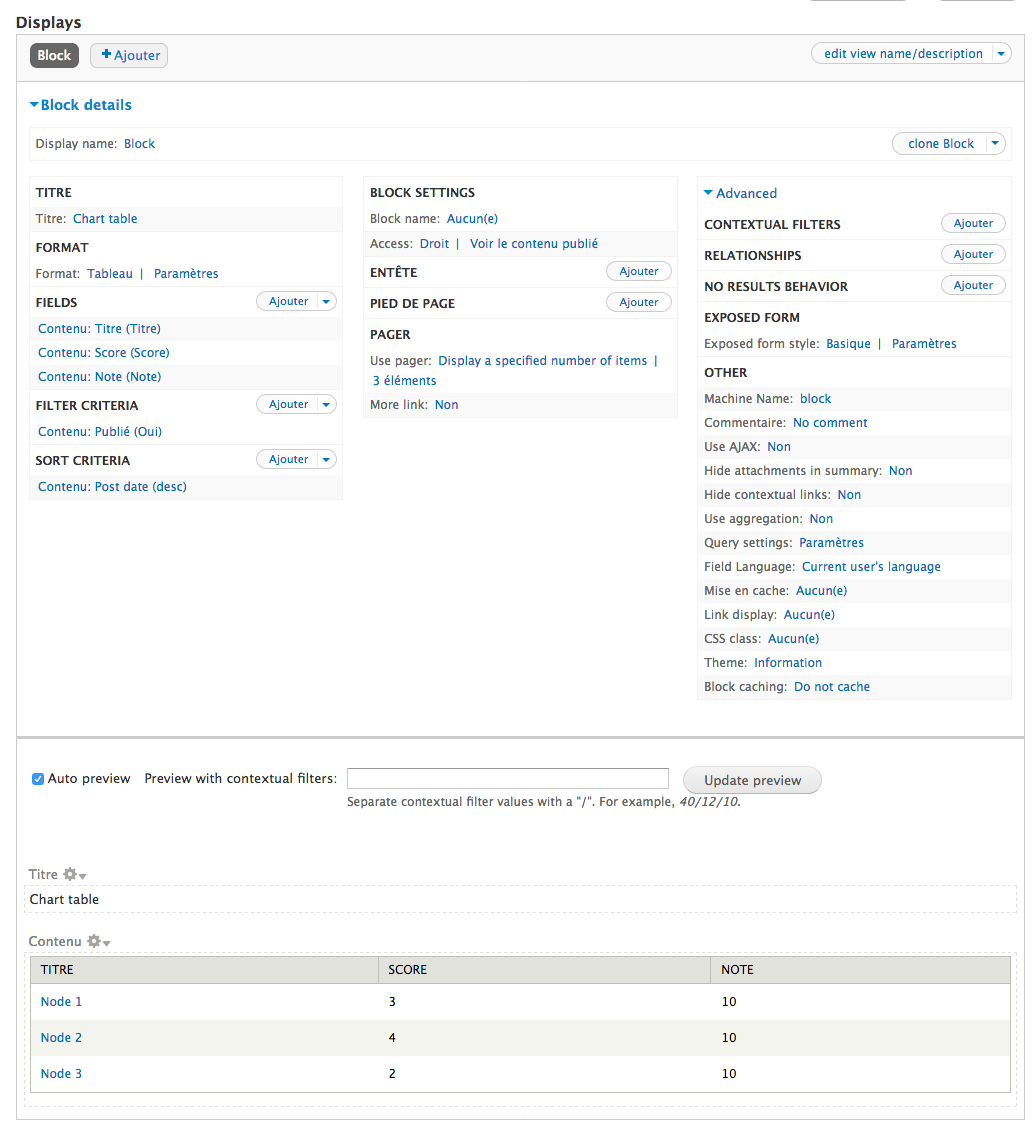
You may find it easier to start with a "Table" display and convert it to a chart display after setting up the data. It can be easier to visualize what the result of the chart will be if it's been laid out in a table first.
In other words: before trying to create a chart, make sure the tabular version of it has the correct data displayed.
Solution 2 - Use Charts to create a Gauge chart
Your sample image in your question rather looks like a Gauge chart. Have a look at the Charts issue about Support for gauge charts. After you apply the patch included in comment # 4 of this issue, you'll be able to use the Charts API to create such Gauge charts (using Google Charts as your charting engine). BTW, you can also use this specific SimplyTest.Me link (which has this patch enabled).
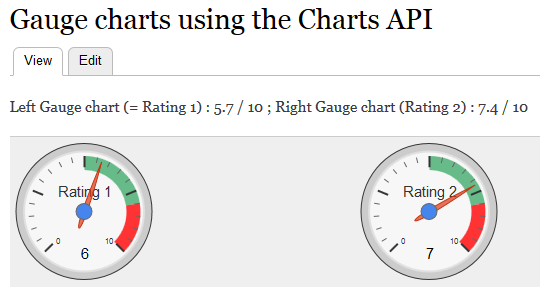
Here is a sample of 2 such charts I created in my own environment (using that patch):

The first (left) chart is to show a rating like 5.7, and the second (right) chart is to show a rating like 7.2 (both ratings on a scale of 10). Attention: I haven't found any specific option (yet) to show that value of 5.7 (and 7.2) in the Gauge chart, instead of the rounded value 6 (and 7) near the bottom. Though the (red) pointer within the chart seems to correctly reflect the actual values already.
My PHP code for rendering the above 2 Gauge charts looks like so (the various options I used should be self explaining):
<?php

 $chart = array(
    '#type' => 'chart',
    '#chart_type' => 'gauge',
    '#chart_library' => 'google',
    '#title' => t('Gauge Chart'),
    '#min' => 0,
    '#max' => 10,
    '#width' => 300,
    '#height' => 300,
    '#greencolor' => '#00AA10',
    '#greenfrom' => 0,
    '#greento' => 5,
    '#redfrom' => 8,
    '#redto' => 10,
    '#redcolor' => '#FF3333',
    '#yellowfrom' => 5,
    '#yellowto' => 8,
    '#yellowcolor' => '#66BB88',
    '#minorticks' => 5,
  );


echo "<p>Left Gauge chart (= Rating 1) : 5.7 / 10 ; Right Gauge chart (Rating 2) : 7.4 / 10 </p>";

  $chart['rating1'] = array(
    '#type' => 'chart_data',
    '#title' => t('Rating 1'),
    '#data' => array(array('Rating1', 5.7)),
  );

  $chart['rating2'] = array(
    '#type' => 'chart_data',
    '#title' => t('Rating 2'),
    '#data' => array(array('Rating2', 7.2)),
  );

  $example['chart'] = $chart;

  return drupal_render($example);
?>
If you paste the above code in the body of any content type that allows using the PHP filter, and assuming you have a working internet connection (prereq to use Google Charts), you should get a similar chart in your own environment (provided you also enabled the patch mentioned before).
With the above solution that uses the Charts API, it should be possible to use the same technique for adding an extra column in your tabular Views display, using "rewrite results", in which you also refer to the actual value of the Score column for each of your views result rows (so that you get 1 Gauge chart somewhere to the right of your Score column).
Disclosure: I'm a co-maintainer of the Charts module.


