6

i currently have the devel module on and i'm trying to figure out why my site is slow. I get the following info line:

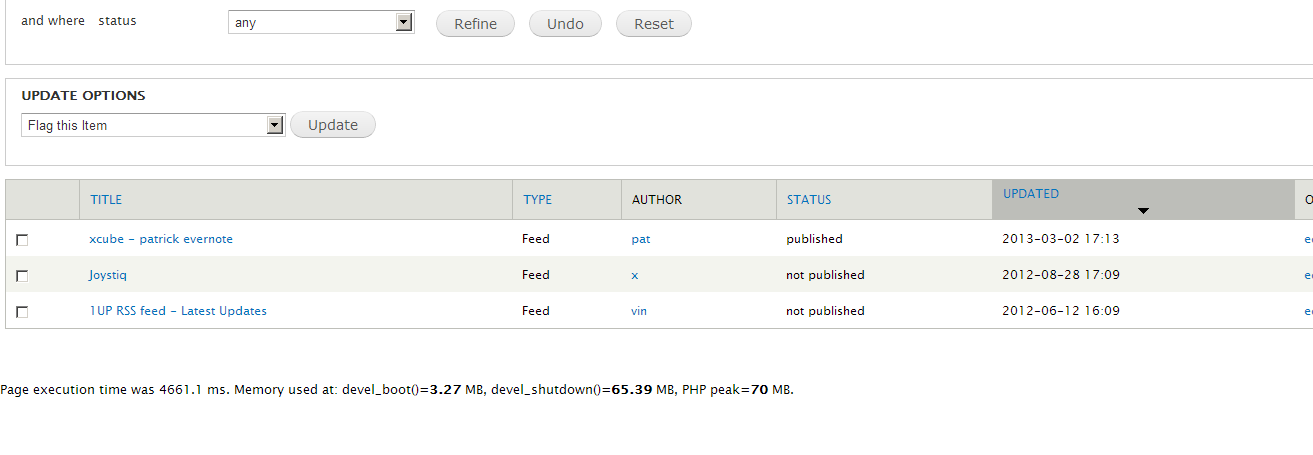
Page execution time was 4661.1 ms. Memory used at: devel_boot()=3.27 MB, devel_shutdown()=65.39 MB, PHP peak=70 MB.

Is there a way to view why my page is taking 4661 ms to load? Here's a view of what the page is loading:

enter image description here

3 Answers 3

7

Yes you can figure out which function(s) spends more time in the execution by using a profiling module, then you can optimize that particular function(s)

Below are the available profiling modules in Drupal 7(AFAIK),

Personally I used XHProf and it helped us lot to improve the performance.

XHProf is a hierarchical profiler for PHP. It reports function-level call counts and inclusive and exclusive metrics such as wall (elapsed) time, CPU time and memory usage. A function's profile can be broken down by callers or callees. The raw data collection component is implemented in C as a PHP Zend extension called xhprof. XHProf has a simple HTML based user interface (written in PHP). The browser based UI for viewing profiler results makes it easy to view results or to share results with peers. A callgraph image view is also supported.

In addition to this you can also look into Performance Logging and Monitoring module which was removed from Devel.
2

You could turn on the devel mysql log to see which queries are taking too long to execute. You can also turn on the mysql slow query log in your mysql my.cnf file.

I suspect you are using views for this page. If that's the case, check the views filters. Try to add proper filtering on index columns from the node table. Or any other index column. In addition to that, check to see you have mysql cache enabled.

1

While Drupal supports a number of awesome profiling tools, such as XHProf –which is being used by the Twig team to insure the new theme system is performant– there are also some online graphing tools you use to instantly see what your page load waterfall looks like.

Pingdom is one that gives you a visual display of all loaded assets and how long they took to render.

For example, here's Pingdom's waterfall graph of the page you are reading now:

http://tools.pingdom.com/fpt/#!/hmCRv/https://drupal.stackexchange.com/questions/76227/how-can-i-view-what-causes-a-page-to-load-slow

--

Also, after I posted this answer I couldn't help noticing you are in New York. Come to NYC Camp next month and learn how to performance tune Drupal: http://nyccamp.org

1
  • hello forest... ;) gotta get xhprof installed. Commented Jun 14, 2013 at 14:34

Your Answer

By clicking “Post Your Answer”, you agree to our terms of service and acknowledge you have read our privacy policy.

Not the answer you're looking for? Browse other questions tagged or ask your own question.