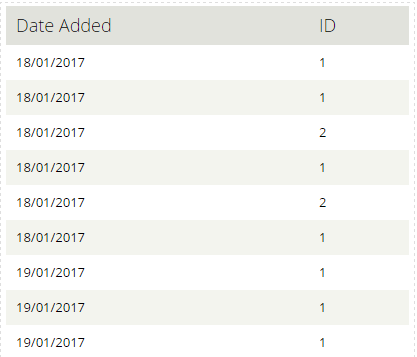
I have a custom database table with a datetime column that I have made accessible to Views. I want to create a line charts of number of rows per day but I can't get the View right.
With aggregation on I have a COUNT on my ID field and I'm trying to group on my date field by day (it currently has year -month - day - hour - minute - second). I have set the date format to d/m/Y and aggregation to group results together but they are still separate.
Obviously this makes for a pretty bad line chart
What I really want is
18/01/2017    23
19/01/2017    25
20/01/2017    19
I tried the Views Date Format SQL Field module (dev version too) but it doesn't seem to work as I don't get an option to format my date as SQL.
Is this possible in Views?


