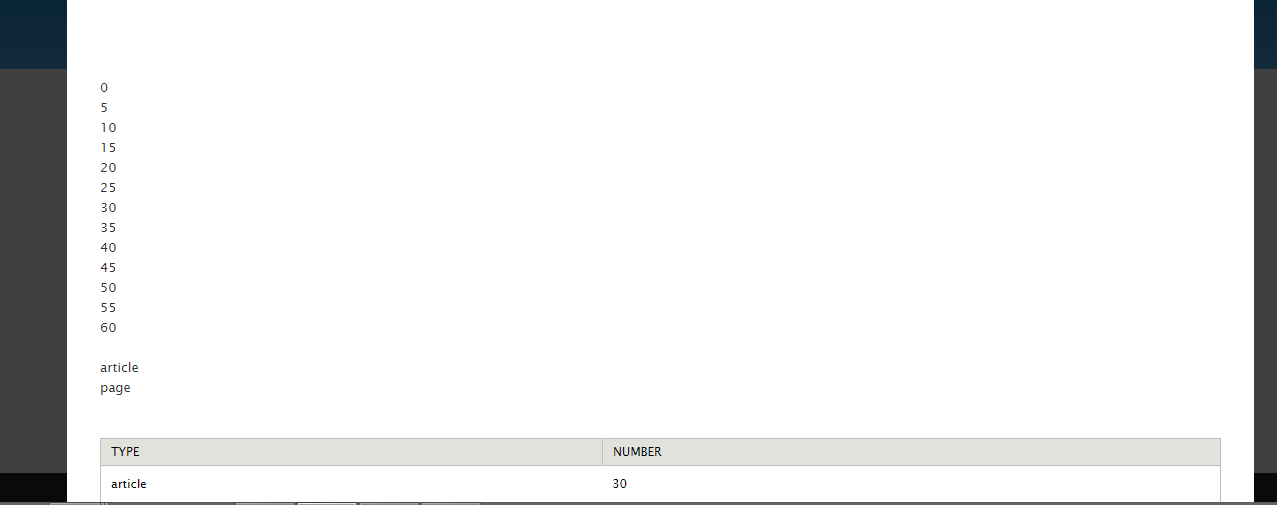
I am trying to create a bar graph using Forena's SVG Graph facilities. But it shows output like this:
As shown in the above image, it is not rendering the SVG Graph properly.
I am using this SQL statement (my "data block" related to the SVG Graph I try to create):
SELECT Type,count(*) as Number
FROM node
GROUP by type
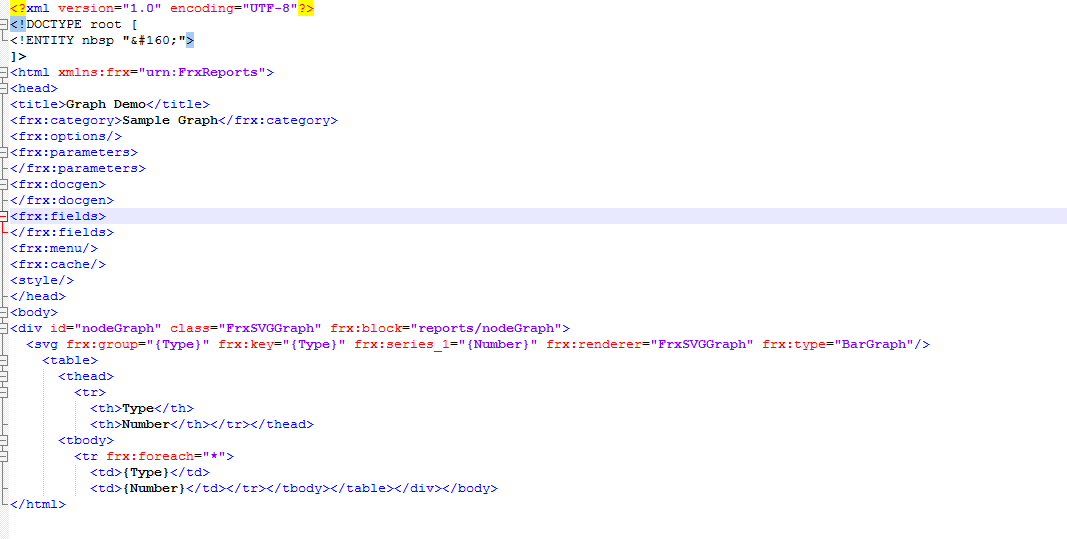
Following is a screenprint of the related FRX file:
And here is a textual version of that FRX file:
<?xml version="1.0" encoding="UTF-8"?>
<!DOCTYPE root [
<!ENTITY nbsp " ">
]>
<html xmlns:frx="urn:FrxReports">
<head>
<title>Graph Demo</title>
<frx:category>Sample Graph</frx:category>
<frx:options/>
<frx:parameters>
</frx:parameters>
<frx:docgen>
</frx:docgen>
<frx:fields>
</frx:fields>
<frx:menu/>
<frx:cache/>
<style/>
</head>
<body>
<div id="nodeGraph" class="FrxSVGGraph" frx:block="reports/nodeGraph">
<svg frx:group="{Type}" frx:key="{Type}" frx:series_1="{Number}" frx:renderer="FrxSVGGraph" frx:type="BarGraph"/>
<table>
<thead>
<tr>
<th>Type</th>
<th>Number</th></tr></thead>
<tbody>
<tr frx:foreach="*">
<td>{Type}</td>
<td>{Number}</td></tr></tbody></table></div></body>
</html>
My question: How to make Forena render my SVG Graph properly?


