1

I have created a report using the module Forena reports. It's a compound graph of 3 items.

I need to mention these 3 items in legend. But I am not able to add more than 1 legend. I am trying to create this graph from the front end itself. I don't want to use the frx file.

2
  • Consider enhancing your question by adding the relevant part of the Forena report that you're trying to create. At least the SVG-tag part of its FRX file that contains frx:renderer="FrxSVGGraph". That may help to answer your question. Commented Oct 7, 2015 at 11:37
  • Sorry about that. I have modified my question as you suggested
    – vipin p
    Commented Oct 8, 2015 at 10:52

2 Answers 2

1

Any attribute supported as PHP SVGGraph options may be included as frx attributes also. Checkout the PHP SVGGraph library documentation to fully understand the available options, and identify the actual SVG Graph option you should be using (there are plenty of them).

In your case, I think you're looking for SVG Graph legends. In your Forena FRX file, you should be able to specify the desired legends (say 1st Legend, 2nd Legend and 3rd Legend) within the SVG tag of your chart with something similar to this example:

  <svg frx:renderer="FrxSVGGraph"
    frx:legend_entries_1="1st Legend"
    frx:legend_entries_2="2nd Legend"
    frx:legend_entries_3="3rd Legend"
    ...
  />

For many more details about how to create charts with Forena, refer to the reports/help.renderers#frxsvggraph in your own site (which is part of what comes with Forena), or refer to the online equivalent of it.

Note: if you only have 1 legend (say MyLegend), the SVG tag of your chart should be similar to this example (no need for the suffixes like _1, etc):

  <svg frx:renderer="FrxSVGGraph"
    frx:legend_entries="MyLegend"
    ...
  />
4
  • Actually I got it working without opening the frx file. I fetched the values that I want for in the sql query itself and mentioned that in the "legends" field.
    – vipin p
    Commented Oct 8, 2015 at 10:55
  • Thanks for the extra feedback. I bet that after you corrected your report (chart) specifications using the WYSIWYG reporting interface as in your comment above, the result of it got saved in the .FRX file using those legend_entries_1, etc as I suggested (which you should see if you browse the FRX file). FYI: the WYSIWYG reporting interface is typically used by Forena newbies (to get started with Forena). After gaining more experienced with Forena, many of its "power" users start using the approach of editing the FRX files (which is just an XHTML file). Commented Oct 8, 2015 at 11:01
  • I didn't have to use WYSIWYG reporting interface. Anyway, thank you for the help.
    – vipin p
    Commented Oct 8, 2015 at 11:07
  • This was not the solution I used. As im entioned in mthe previous comment I got it working without using the frx file. Editing the frx file was causing problems for me . After saving the frx file, if you edit the graph from front end the above solution won't work.
    – vipin p
    Commented Oct 9, 2015 at 4:24
1

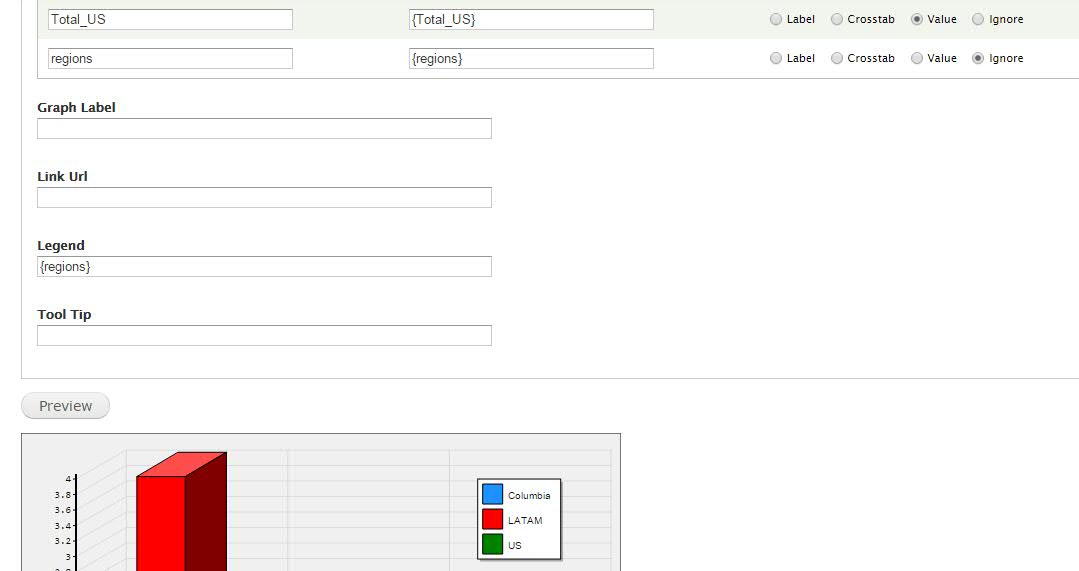
This is how I got it working. I fetched the values I want to show as the legends in the sql query I used itself. Then I assigned this value as the legend. Please find the screenshot.

enter image description here

Your Answer

By clicking “Post Your Answer”, you agree to our terms of service and acknowledge you have read our privacy policy.

Not the answer you're looking for? Browse other questions tagged or ask your own question.