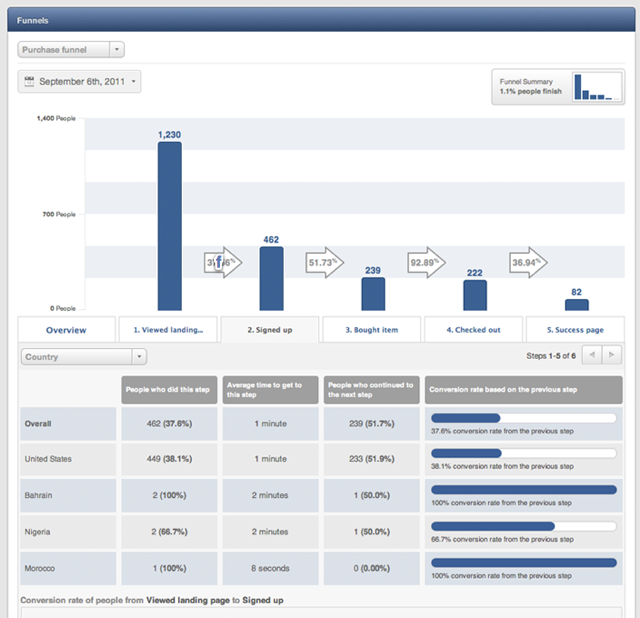
module google analytic report with charts activated do the work
EDIT:
i don't know if i exactly reply to your needs but google analytics report module create a default view to display a summary charts and datas tabs from GA datas.
These drupal attached views can be modified and extended with adding GA:session variables such as
Adsense metrics: AdSense Exits
The number of sessions that ended due to a user clicking on an AdSense ad.
API name: ga:adsenseExits.
Ecommerce calculated metrics: Ecommerce Conversion Rate
The average number of transactions for a session on your property.
Calculation: ga:transactions / ga:sessions.
API name: ga:transactionsPerSession.
Ecommerce dimensions: Sessions to Transaction
The number of sessions between users' purchases and the related campaigns that lead to the purchases.
API name: ga:sessionsToTransaction.
Event tracking calculated metrics: Events / Session with Event
The average number of events per session with event.
Calculation: ga:totalEvents / ga:sessionsWithEvent.
API name: ga:eventsPerSessionWithEvent.
Event tracking metrics: Sessions with Event
The total number of sessions with events.
API name: ga:sessionsWithEvent.
Goal conversions calculated metrics: Goal Conversion Rate
The percentage of sessions which resulted in a conversion to at least one of your goals.
Calculation: ga:goalCompletionsAll / ga:sessions.
API name: ga:goalConversionRateAll.
Goal conversions calculated metrics: Goal XX Conversion Rate
The percentage of sessions which resulted in a conversion to the requested goal number.
Calculation: ga:goalXXCompletions / ga:sessions.
API name: ga:goalXXConversionRate.
Goal conversions calculated metrics: Per Session Goal Value
The average goal value of a session on your property.
Calculation: ga:goalValueAll / ga:sessions.
API name: ga:goalValuePerSession.
Internal search calculated metrics: % Sessions with Search
The percentage of sessions with search.
Calculation: ga:searchSessions / ga:sessions.
API name: ga:percentSessionsWithSearch.
Internal search calculated metrics: Site Search Goal Conversion Rate
The percentage of search sessions (i.e., sessions that included at least one search) which resulted in a conversion to at least one of your goals.
Calculation: ga:goalCompletionsAll / ga:searchUniques.
API name: ga:searchGoalConversionRateAll.
Internal search calculated metrics: Site Search Goal XX Conversion Rate
The percentage of search sessions (i.e., sessions that included at least one search) which resulted in a conversion to the requested goal number.
Calculation: ga:goalXXCompletions / ga:searchUniques.
API name: ga:searchGoalXXConversionRate.
Internal search metrics: Sessions with Search
The total number of sessions that included an internal search
API name: ga:searchSessions.
Page tracking calculated metrics: Pages / Session
The average number of pages viewed during a session on your property. Repeated views of a single page are counted.
Calculation: ga:pageviews / ga:sessions.
API name: ga:pageviewsPerSession.
Page tracking dimensions: Page Depth
The number of pages visited by users during a session. The value is a histogram that counts pageviews across a range of possible values. In this calculation, all sessions will have at least one pageview, and some percentage of sessions will have more.
API name: ga:pageDepth.
Session calculated metrics: Avg. Session Duration
The average duration of user sessions represented in total seconds.
Calculation: ga:sessionDuration / ga:sessions.
API name: ga:avgSessionDuration.
Session calculated metrics: Bounce Rate
The percentage of single-page session (i.e., session in which the person left your property from the first page).
Calculation: ga:bounces / ga:sessions.
API name: ga:bounceRate.
Session metrics: Bounces
The total number of single page (or single engagement hit) sessions for your property.
API name: ga:bounces.
Session metrics: Session Duration
The total duration of user sessions represented in total seconds.
API name: ga:sessionDuration.
Session metrics: Sessions
Counts the total number of sessions.
API name: ga:sessions.
Social interactions metrics: Unique Social Actions
The number of sessions during which the specified social action(s) occurred at least once. This is based on the the unique combination of socialInteractionNetwork, socialInteractionAction, and socialInteractionTarget.
API name: ga:uniqueSocialInteractions.
Time dimensions: Hour
A two-digit hour of the day ranging from 00-23 in the timezone configured for the account. This value is also corrected for daylight savings time, adhering to all local rules for daylight savings time. If your timezone follows daylight savings time, there will be an apparent bump in the number of sessions during the change-over hour (e.g. between 1:00 and 2:00) for the day per year when that hour repeats. A corresponding hour with zero sessions will occur at the opposite changeover. (Google Analytics does not track user time more precisely than hours.)
API name: ga:hour.
Traffic sources dimensions: Social Source Referral
Indicates sessions that arrived to the property from a social source. The possible values are Yes or No where the first letter is capitalized.
API name: ga:hasSocialSourceReferral.
User calculated metrics: % New Sessions
The percentage of sessions by people who had never visited your property before.
Calculation: ga:newUsers / ga:sessions.
API name: ga:percentNewSessions.
User dimensions: Count of Sessions
The session index for a user to your property. Each session from a unique user will get its own incremental index starting from 1 for the first session. Subsequent sessions do not change previous session indicies. For example, if a certain user has 4 sessions to your website, sessionCount for that user will have 4 distinct values of 1 through 4.
API name: ga:sessionCount.


