3

I have a D7 site with around 300,000 nodes. I am passing this function an array of 300-500 nids. Sometimes the function runs in under a second. Sometimes it takes 40 seconds or more! I can't figure out what causes the slow runs. How can I get the query consistent and fast?

function _load_field_values_for_nids($field_name, $nids)
{
  $field_info = field_info_field($field_name);
  $field_id = $field_info['id'];

  $map = array();
  $nodes_without_required_field = [];

  // Load up the properties from the node table.
  $sql = 'SELECT * FROM {node} WHERE nid IN (:nids)';
  $nodes = db_query($sql, array(':nids' => $nids))->fetchAllAssoc('nid');

  // Attach the single field to all nodes.
  field_attach_load('node', $nodes, FIELD_LOAD_CURRENT, array('field_id' => $field_id));

  foreach ($nodes as $nid => $node) {

    if (isset($node->{$field_name}['und'])) {
      $map[$node->nid] = $node->{$field_name}['und'][0]['value'];
    } else {
      $nodes_without_required_field[] = $node->nid;
    }
  }

  $absent_count = count($nodes_without_required_field);
  if ($absent_count > 0) {
    watchdog("vwyw_load_fields", $absent_count." nodes did not have field, \"".$field_name."\" ");
  }

  return $map;
}

I noticed this SIX-SECOND query on the main /admin/content page (which took 12+seconds to load):

Six Second Query to Count Available Content

Here is the expanded XHProf output regarding that Count query:

enter image description here

I think this might be a mysql configuration issue rather that the particulars of a query. For instance, I think this query should run very quickly but it takes a second and a half:

enter image description here

The next time (same page load) it took 120ms and the time after that, 4.8sec!

UPDATE

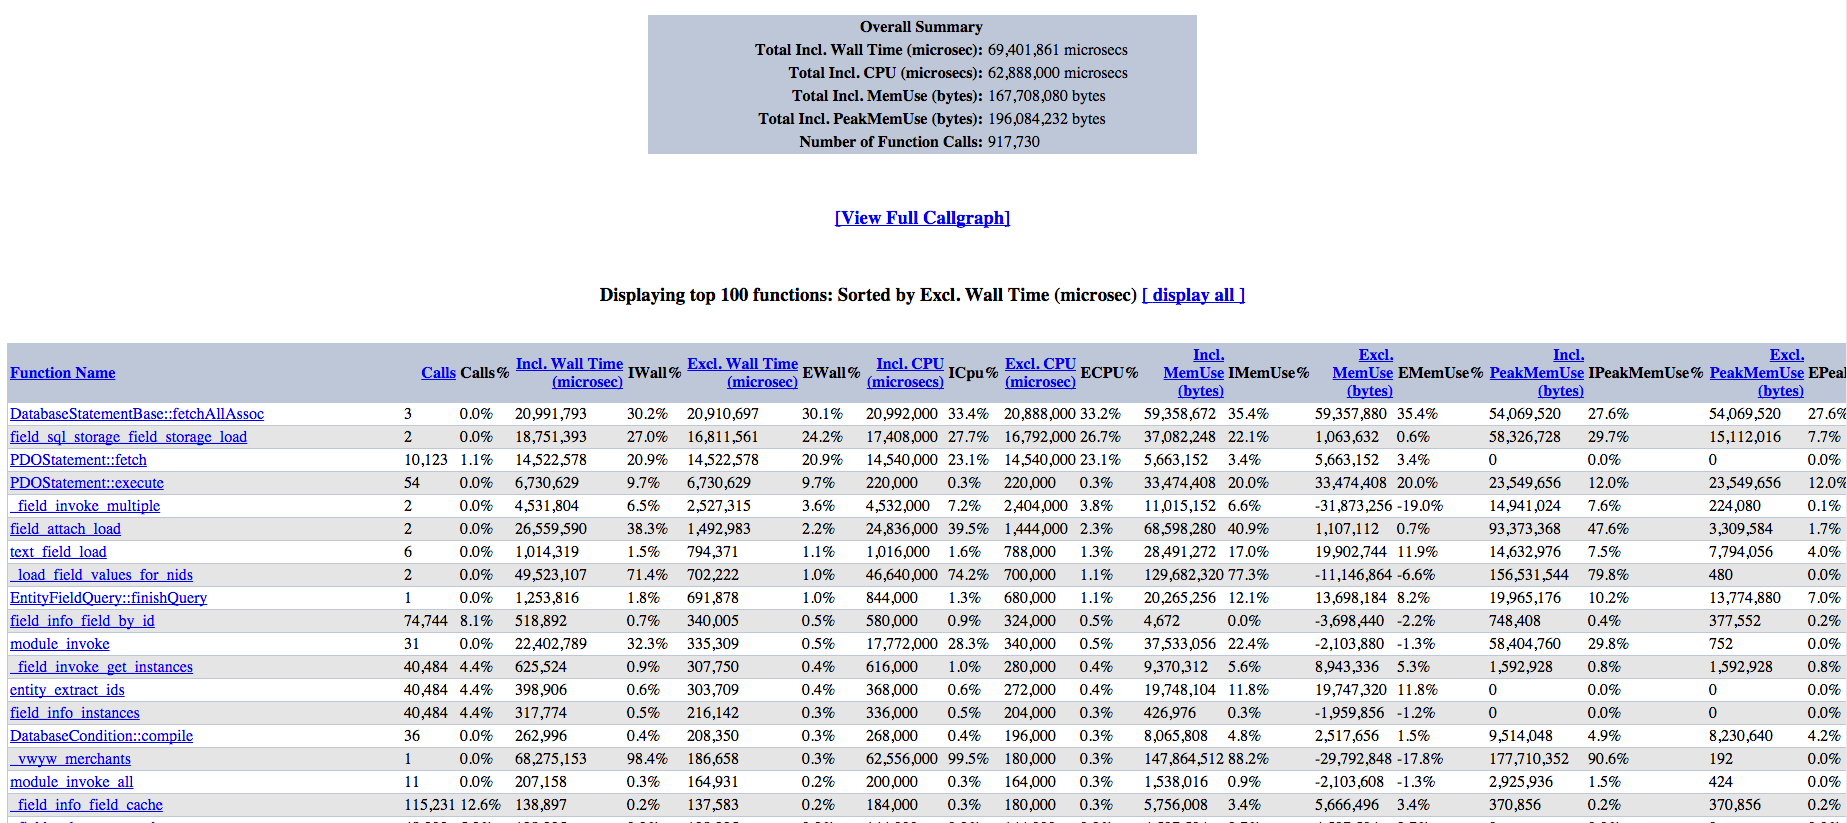
Here is the XHProf output sorted by duration for a simple admin page that calls the function:

enter image description here

0

1 Answer 1

4

I'm guessing that the difference between the fast runs and the slow runs is caching. Within field_attach_load is a call to cache_get_multiple(). The field values can load from a cache which should be a lot faster: https://api.drupal.org/api/drupal/modules!field!field.attach.inc/function/field_attach_load/7

To investigate further I recommend using devel module's query logger. It can show the amount of time spent within queries. If that is not sufficient you can use a profiler like XHProf or Blackfire to see exactly which function calls are taking the most time.

3
  • Installed xhprof... I am calling the function from a Services resource. Will I need to create a test page that calls it to see the xhprof output? Commented Dec 15, 2015 at 17:58
  • There is a query on /admin/content taking six seconds - should be related to the same issue I think. I posted Devel log and XHProf output for that above. Thanks for your insights! Commented Dec 15, 2015 at 18:17
  • It's probably going to be all those LEFT JOINs @Joe, do you have a fair number of users/content/taxonomy terms? Depending on what data the View actually needs you may be able to alter those to INNER for a decent speed increase. If you can get details on what the subquery in there is doing too, that would help
    – Clive
    Commented Dec 15, 2015 at 18:25

Your Answer

By clicking “Post Your Answer”, you agree to our terms of service and acknowledge you have read our privacy policy.

Not the answer you're looking for? Browse other questions tagged or ask your own question.