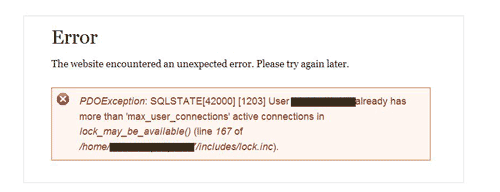
A user reported to me seeing the following error on his screen:

The watchdog entry for this error looks like this:
PDOException: SQLSTATE[HY000]: General error: 1205 Lock wait timeout exceeded; try restarting transaction: INSERT INTO (.............)
I would like this kind of errors not to be displayed in detail on user screens.
However, I am not able to replicate this problem of displaying error in detail on the screen. During my tests, SQL errors are NOT displayed in detail at all. So, even if I apply a solution (like setting display_errors to FALSE in settings.php) I won't be able to test it, because I can't replicate this particular scenario which causes errors to be displayed on screen with details.
As part of the testing, I've made a deliberate mistake (in table name) in a database query in mymodule_node_view to test how such error will be visible on user screen. The problem is that in both cases, whether display_errors is turned "on" or "off" (checked on Site Status report: http://example.com/admin/reports/status/php), the result is identical. On user screen the error is displayed as:

It's not displaying any details, although in the watchdog log, it is similarly also a PDOException:
PDOException: SQLSTATE[42S02]: Base table or view not found: 1146 Table 'mydb.nodeaa' doesn't exist: SELECT (..............)
So, I don't understand. Why is Drupal displaying details of some PDOExceptions on user screen and not displaying details of some other PDOExceptions? How to effectively check whether a setting (e.g. display_errors set to "off") will fix the problem for all sorts of PDOException?
