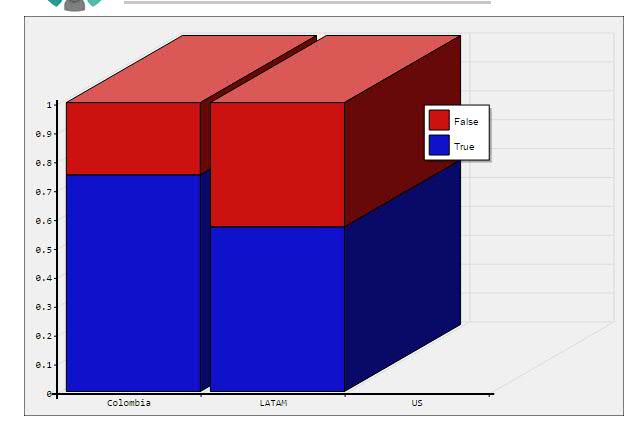
Option 1 - Try another chart type
I recommend you experiment a bit with some of Forena's other Supported chart types, as documented within the "FrxSvgGraph" section of the "Custom Renderers"chapter (located with /reports/help.renderers#frxsvggraph of your site, and similar to this online equivalent).
More specifically, you seem to be using frx:type="StackedBar3DGraph". I think you will get way better results (to show the corresponding values) if you try with some of the other chart types, especially these ones:
- MultiLineGraph
- GroupedBarGraph
- GroupedCylinderGraph
Option 2 - Add specific SVG Graph settings
If using another chart type is not what you want (= it has to be a Stacked Bar Graph in 3D), then you need to find the appropriate SVG Graph setting(s) (there are dozens, if not hundreds, of them ...) and pass such setting(s) as extra FRX attributes.
In that case, you may want to use some of the SVG Graph general settings. I haven't experimented with them, but I think you may want to try with these settings:
show_data_labels, which is a boolean (default = false), to "display labels for bars, markers or pie slices". In Forena, if you want to set this option to true, you'd specify it in your frx file like frx:show_data_labels="yes".- any of the settings starting with
data_labels_... (there are dozens of them ...), to tune the data labels, like their fonts, positioning, etc.
Note: SVGGraph data labels explains some of the options related to labels, and how to use them.


